A Gartley pattern appears to be coming to completion on the EURUSD daily chart. The triangle ratios are very close to ideal. It is also interesting to note the successful butterfly pattern prior - the completion of which begins the Gartley pattern.
 |
| Gartley Pattern - EURUSD DAILY |
 |
| Butterfly (red) followed by Gartley (pink) - EURUSD DAILLY |
Gartley Defined:
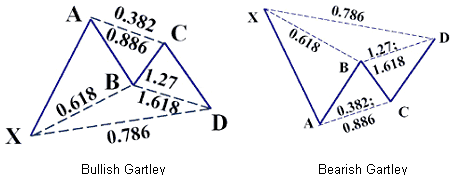
The pattern in question is the "Bearish Gartley" shown on the right below - the formation of which usually signifies a reversal from an uptrend.
The definition of a Gartley pattern, as defined by Investopedia.com:
"Investopedia explains Gartley Pattern
The above Gartley example shows an uptrend XA with a price reversal at A. Using Fibonacci ratios, the retracement AB should be 61.8% of the price range A minus X, as shown by line XB. At B, the price reverses again. Ideally, retracement BC should be between 61.8% and 78.6% of the AB price range, not the length of the lines, and is shown along the line AC. At C, the price again reverses with retracement CD between 127% and 161.8% of the range BC and is shown along the line BD. Price D is the point to buy/sell (bullish/bearish Gartley pattern) as the price is about to increase/decrease."