Sunday, June 5, 2011

New Indicator Available for Download!

Hi all,

I have added a download link for my automatic multi-colored fib-fan with customizable levels.  Check out the custom indicators page or:


The auto-trend retracement indicator automatically draws relevant trendlines, and then draws Fibonacci retracements from the original trend line origin in an attempt to "paint" the course of the currency through the visualization of multiple trend lines - each serving as support and resistance.  All settings are changeable through user inputs, including the specific Fibonacci retracement levels, colors, style, etc.  It can "paint" from as many as FOUR trend line origins, to as little as one - whichever suits the style of the trader.


Thursday, May 26, 2011

AUDNZD - Daily Set Up

Hey guys,

I've got a long setup on the AUDNZD.  The pair has been in a downtrend since February of this year, but is touching the lower boundary of the up trend that has bee dominating the direction of the pair dating all the way back to August of 2005.  For this reason, I think that the longterm uptrend should continue near current levels, and a reversal to the short term downtrend is due.  My strategy for this trade involves two targets - at the first target I am taking partial profits (60-80% of my position) and moving my stop loss to break even.  This locks in a healthy profit, and allows the trade to run for even greater profits at NO RISK as profits have already been taken and the stop is at break even.  This is a simple strategy that can seriously increase rewards while decreasing risk.  Some traders have a hard time letting their profits run because they want to take the money and get out.  By taking partial profits you satisfy this need to take profits, and allow a smaller portion of the trade to add significant gains.  At the end of a trading year it is possible that you have multiple small positions open that amount to a nice little equity train.  To get the proper position size for your account and risk tolerance please make sure to download my risk calculator. DOWNLOAD

I have entered:

Long: 1.3100
Stop: 1.3020
Profit 1: 1.3200 (close 60-80% of position)
Profit 2: 1.3400 (close the rest of the position)


Monday, May 23, 2011

GOLD - Daily Settup

I've been quiet for a while, but this set up on gold should make up for it!

Gold is consolidating and is at the highs of it's consolidation.  Now would be a good time to short gold, looking for a break to new lows.  If this break does not happen, it is likely that profits can be taken as the metal consolidates to the downside of the current price.


Cheers!

Thursday, May 5, 2011

AUDUSD - rebound in sight

There is a potential rebound coming on the AUDUSD - buy at market.  This might be risky, considering the strong down move.  However, the longer term uptrend should give the aussie some support, and I can expect somewhat of a rebound from the trend line drawn on the chart.


Tuesday, April 19, 2011

AUDUSD - Intrday/Swing Opportunity

Hey everyone,


Intraday trading opportunity on the AUDUSD.


Entry: Buy Limit 1.0440
Stop: 1.0380
Target: 1.0580

AUDUSD - Intraday/Swing Opportunity

Tuesday, April 12, 2011

EURUSD - Long term trend reversal?

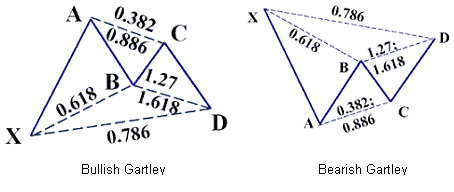
A Gartley pattern appears to be coming to completion on the EURUSD daily chart. The triangle ratios are very close to ideal.  It is also interesting to note the successful butterfly pattern prior - the completion of which begins the Gartley pattern.

Gartley Pattern - EURUSD DAILY

Butterfly (red) followed by Gartley (pink) - EURUSD DAILLY

Gartley Defined:

The pattern in question is the "Bearish Gartley" shown on the right below - the formation of which usually signifies a reversal from an uptrend.

The definition of a Gartley pattern, as defined by Investopedia.com:


"Investopedia explains Gartley Pattern
The above Gartley example shows an uptrend XA with a price reversal at A. Using Fibonacci ratios, the retracement AB should be 61.8% of the price range A minus X, as shown by line XB. At B, the price reverses again. Ideally, retracement BC should be between 61.8% and 78.6% of the AB price range, not the length of the lines, and is shown along the line AC. At C, the price again reverses with retracement CD between 127% and 161.8% of the range BC and is shown along the line BD. Price D is the point to buy/sell (bullish/bearish Gartley pattern) as the price is about to increase/decrease."

Monday, April 11, 2011

AUDUSD - Opportunity

I believe that the AUDUSD will continue it's uptrend, with support coming from the lower channel trend line.

AUDUSD